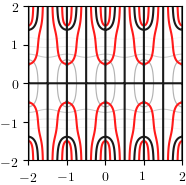
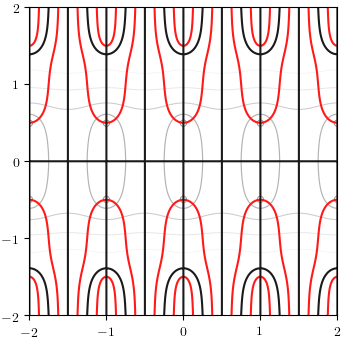
Image: X-ray of
on

Download: png (small) — png (medium) — png (large) — pdf (small) — pdf (medium/large) — svg (small) — svg (medium/large)
An X-ray plot illustrates the geometry of a complex analytic function . Thick black curves show where
(the function is pure real). Thick red curves show where
(the function is pure imaginary). Points where black and red curves intersect are zeros or poles. Magnitude level curves
are rendered as thin gray curves, with brighter shades corresponding to larger . Blue lines show branch cuts. The value of the function is continuous with the branch cut on the side indicated with a solid line, and discontinuous on the side indicated with a dashed line. Yellow is used to highlight important regions.
Definitions:
| Fungrim symbol | Notation | Short description |
|---|---|---|
| JacobiTheta | Jacobi theta function | |
| ConstI | Imaginary unit | |
| ClosedInterval | Closed interval | |
| Im | Imaginary part | |
| Re | Real part | |
| Abs | Absolute value |
Source code for this entry:
Entry(ID("8c9f96"),
    Image(Description("X-ray of", JacobiTheta(4, z, ConstI), "on", Element(z, Add(ClosedInterval(-2, 2), Mul(ClosedInterval(-2, 2), ConstI)))), ImageSource("xray_jacobi_theta_4_z")),
    Description("An X-ray plot illustrates the geometry of a complex analytic function", f(z), ".", "Thick black curves show where", Equal(Im(f(z)), 0), "(the function is pure real).", "Thick red curves show where", Equal(Re(f(z)), 0), "(the function is pure imaginary).", "Points where black and red curves intersect are zeros or poles.", "Magnitude level curves", Equal(Abs(f(z)), C), "are rendered as thin gray curves, with brighter shades corresponding to larger", C, ".", "Blue lines show branch cuts.", "The value of the function is continuous with the branch cut on the side indicated with a solid line, and discontinuous on the side indicated with a dashed line.", "Yellow is used to highlight important regions."))